Introduction of DFWCars.com
DFWCars.com is a leader solution provider that enables customers to buy and sell cars through a digital marketplace. DFWCars.com application was founded in 2019 in Dallas, Texas by a group of SMU students who sense an opportunity to help students get a better online car-shopping experience. The application provides a variety of information about different cars and dealerships for customers to obtain. We believe that this application will enable students to overcome many challenges such as communication, transportation, and system and process familiarity. In addition, we are confident that our data-driven engine search will smooth the hectic process and enrich it with reliable and accurate information about cars and dealerships.
Scope of the Project
The website will provide users (students) to buy and sell cars in the DFW area. The users are provided with options to input their personal information, preferences and budget into the application, and the algorithm behind will return recommendations. Students are provided with insights of the nearest dealers and private sellers including their rating, location, and a history of their vehicles sales. The website provides students with the cars’ information that best fit their needs as below :
● Customer: Student ID, budget, preference (make, model, year…etc.)
● Location: Longitude, Latitude, zip code, City, School
● Cars: VIN #, manufacture, model, year, features, Carfax report, mileage, type
● Price: fair price, sale price
● Recommendation: dealer rating, customer feedback
Goals of the Project
The intended users for this database are students including international students from different universities and different dealerships in the DFW area. The database will facilitate the process of buying a car for international students attending universities in the US. The application will increase efficiency in the car search by providing a special feature that enables verified students to get special promotions, and offer the eligibility of payment plan without the need of social security number. This application benefits the dealers as well , since it assists in generating more revenues by increasing their car sales.
Conceptual Design & Logical Design
Tables Contained in E-R Diagram:
● Student: Information from students such as his ID and unique password to make use of the app
Includes: Student Id and Student_PW_
● Order: Basic information that distinguishes each order
Includes: Order_Id, Year, Month, Day, Vin, Sold_Price, Student_ID
● Vehicle Info: Descriptive information of the cars Includes: VIN, price, year, manufacturer, make, odometer, paint_color, image_url, Dealer_ID
● Car Check: Information to check background information from cars
Includes: VIN, title_status, condition, report_link, Score
● Dealer: Personal information from dealers including location from nearest dealers
Includes: Dealer_ID, Dealer_Name, Address, Phone, Latitude, Longitude
Reasons for E-R Diagram Design:
DFWCars.com is an app that provides competitive prices and accurate information about cars in the U.S. market for students. Our operational database/UI is focused exclusively to the following business units: Students and Car Dealers. We picked these entities due to their strong relationship on each other. The system can be managed by dealers/car sellers in order to record all aspects pertinent to the car information and their personal information.
Dataset
The data used in our project was found on Kaggle – Kaggle Data. Since the dataset was not exhaustive, we had to generate a database demo and merge it with the original dataset from Kaggle. However, Latitude, Longitude and Student ID was generated due to privacy measures.
ER-Diagram
We have three main tables including student, vehicle information and dealer information in the ER-Diagram (Exhibit 1).
Exhibit 1
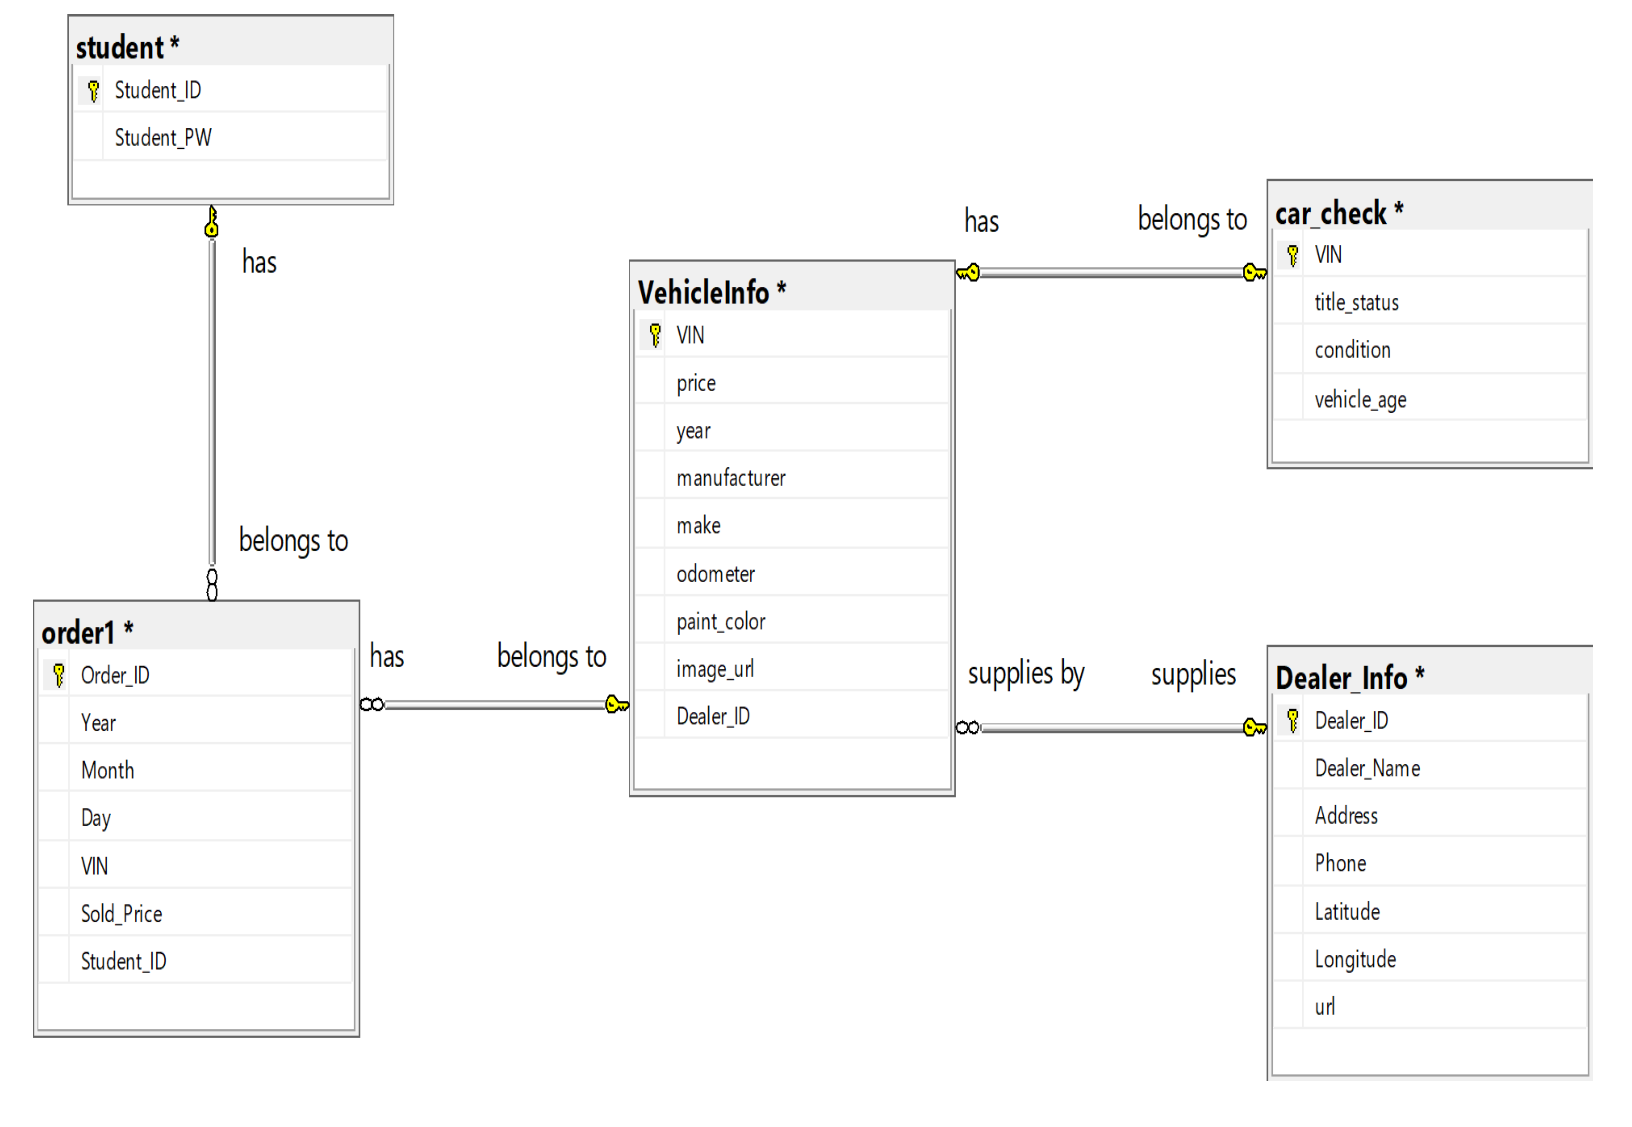
● The student table: consists of student id and the student password to log into the application. Student Id is the primary key of the student table and the foreign key for the Order table. When a student signs up for the system, the UI generates a unique password for them.
● The Vehicle Info table: has the VIN as its primary key. Based on the primary key, we can get the details of the cars. Dealers can list their cars by inputting price, year, manufacturer, make, odometer, paint color and even attach an image of the car. Once the car is listed into the database, it will automatically upload as part of the inventory and then when a customer makes an order it will be removed from the list of cars available and moved to the orders table.
● The dealer information table: uses Dealer_ID as its primary key and connects with the other two tables as a foreign key. The dealer information tables contain details pertaining to the seller of the car. Besides having personal information from the dealer in order to contact them, the table contains the physical location of the car (latitude and longitude).
● Car check table: allows buyers to make a check of the title status, condition, report and score of the car. This table was created in order to promote the security of the buyer and prevent any potential illegal origin, stolen cars, unauthorized software, etc.
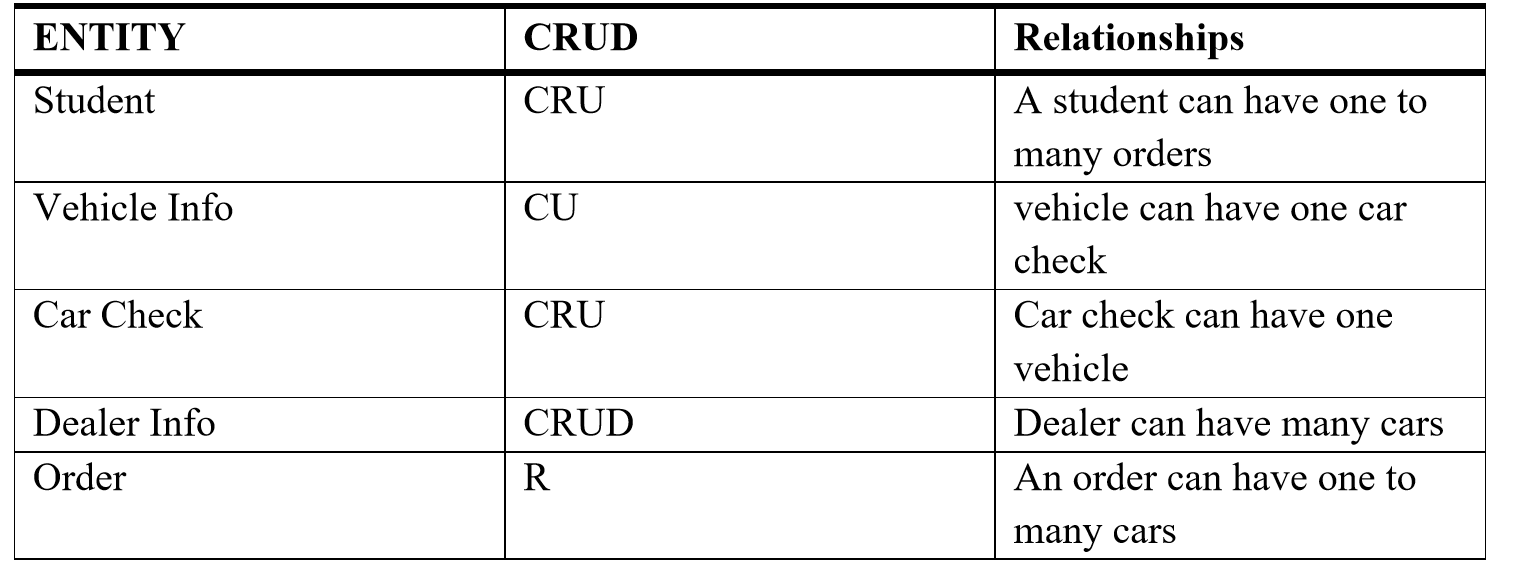
Relationships / CRUD OPERATIONS
Specifically, create, read, update and delete are four basic functions of persistent storage. The following Exibit 2 shows CURD functions in DFWCars.com project.
Exhibit 2
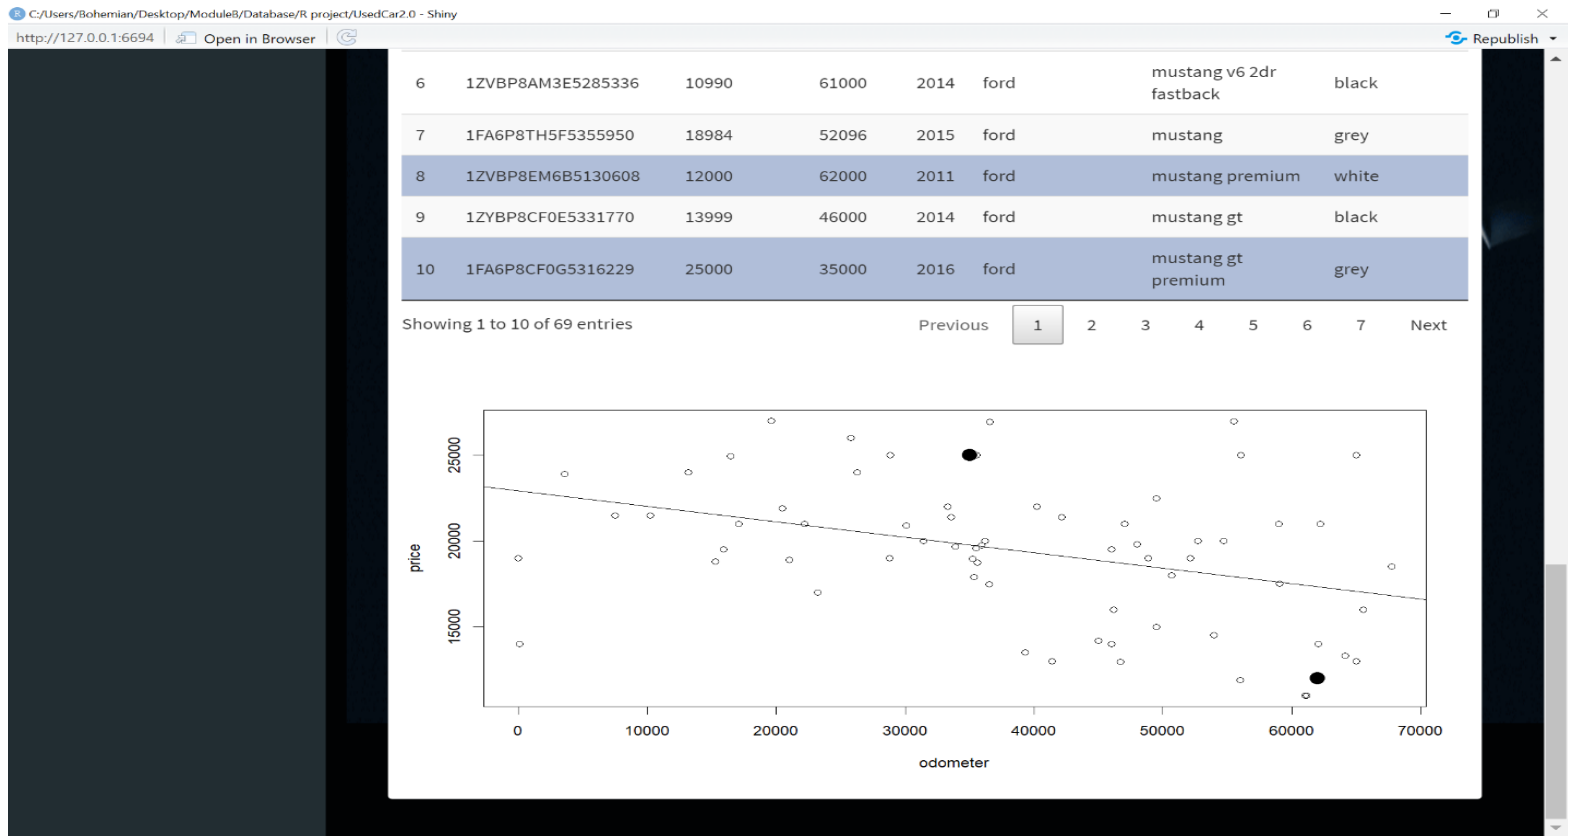
Shiny/UI
We designed a Shiny application that interacts with MySQL database and performs CRUD operations. We read data from MySQL database and used R to analyze car data. The functions of the Shiny application are listed below.
Two accounts
In our dashboard, we designed two types of user accounts. One is for administrator, the other is for customers. The administrator has access to all the car data in database and can edit, delete any information. The customer account is for end users where they can search and enter new car’s information.
Two search functions
two search functions where we allow our users to do some basic search operations. The “Buy a car” enables customers to enter any specs of the car they want. The “Sell a car” enables customer to enter any information of the car they want to sell.
Insert, Update, and Delete functions
The insert function enables internal users to add a car with detailed information: name of the car, year, price, manufacture, and image URL. Besides, we also created update function, where users can edit the information they entered before. Finally, delete function could be used to delete any car by administrator. Once the car is sold, the information related to this car will be automatically deleted from vehicle database and pasted to order database. However, due to security control, external users are not allowed to delete any cars.
Analytics
● Market share - Users can visualize the different demand for a variety of car models
● Car recommendation - Users can obtain recommendations on car models based on customers inputting features
● Inventory management- Users have the opportunity to manage prices and inventory by visualizing customers demand
● Sellers map - Users can view dealerships’ locations on a map
Appendix
Exhibit 3
Data Dictionary
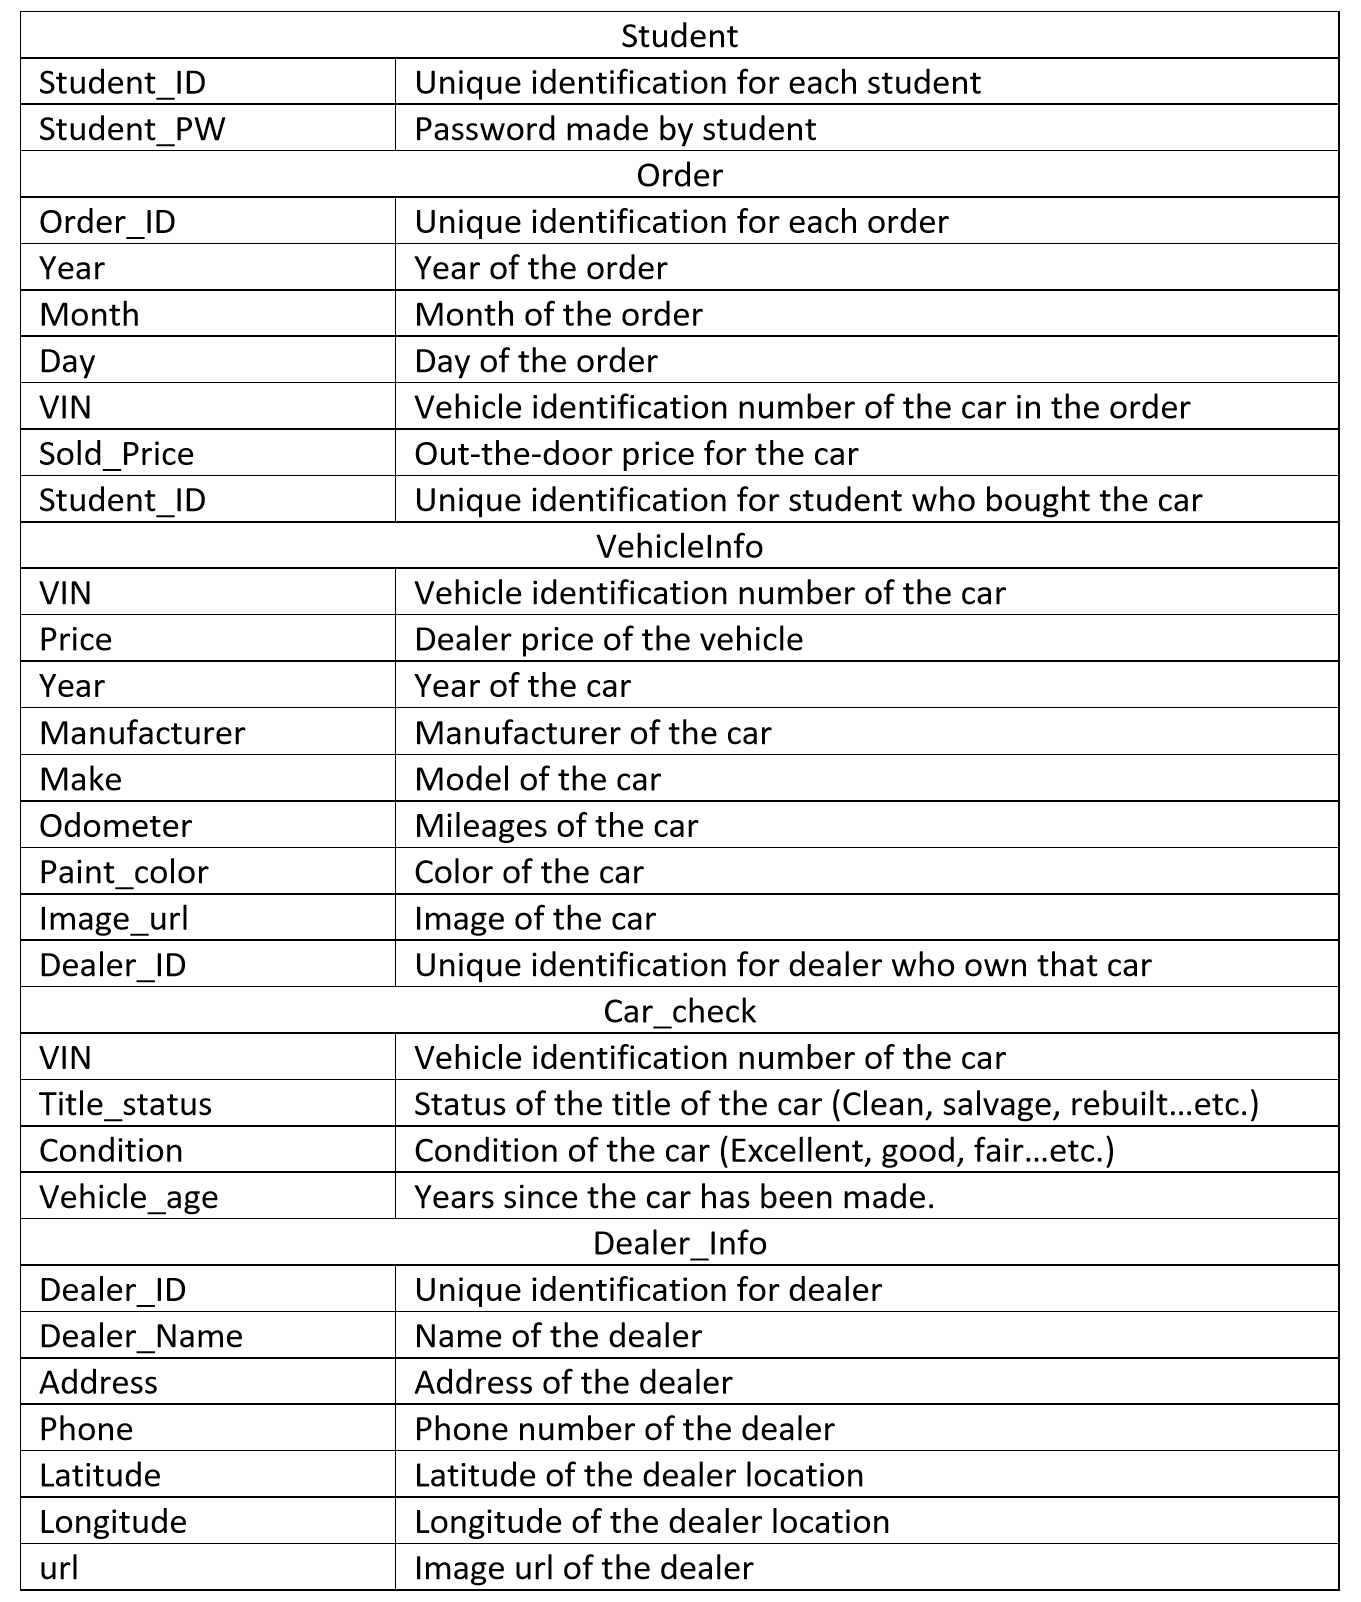
Exhibit 4
This exhibit shows that the users need to register in order to use the service provided, students and dealers need to have users to improve reliability and credibility
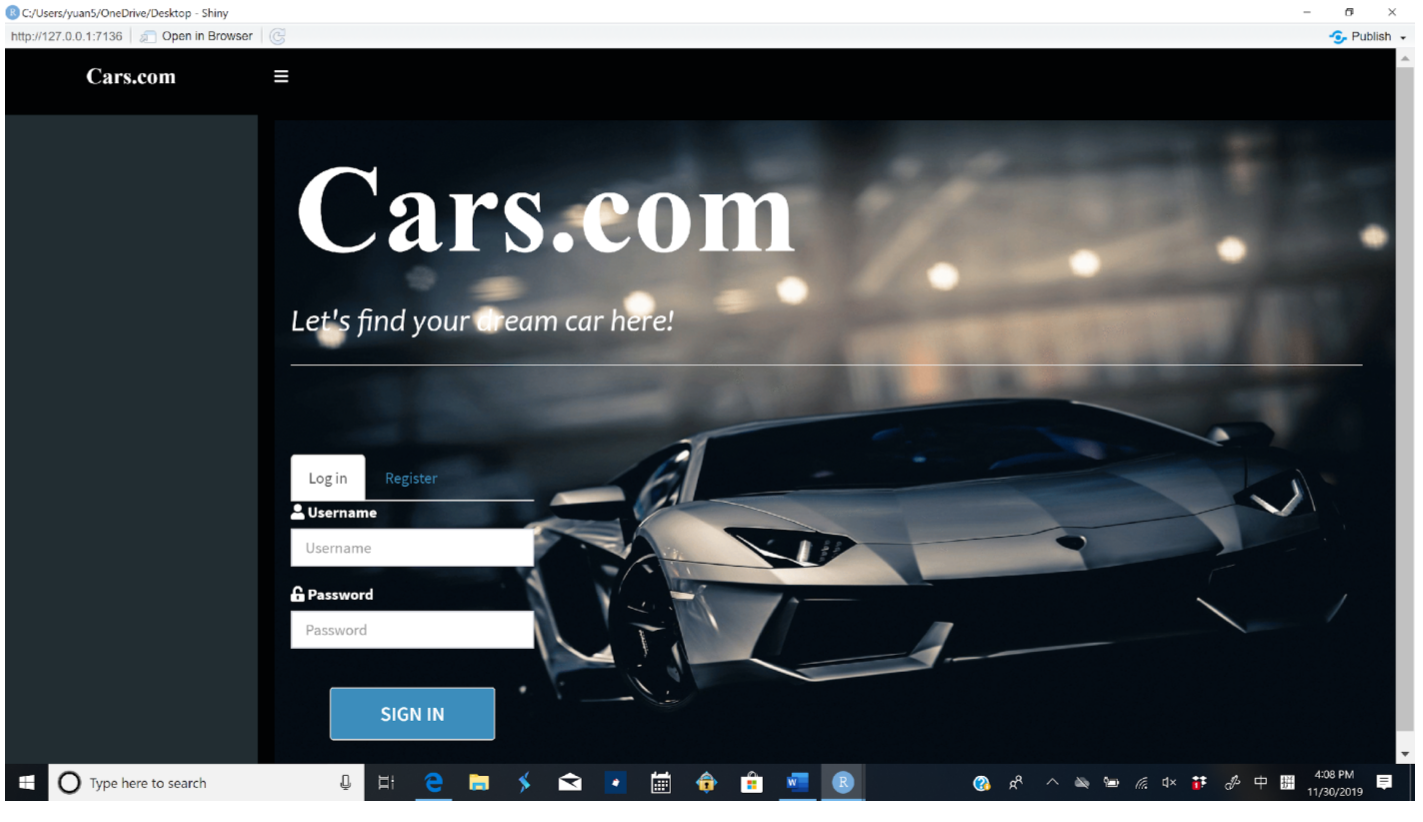
Exhibit 5
This exhibit shows the buy page for students where they can input features to get filtered car results
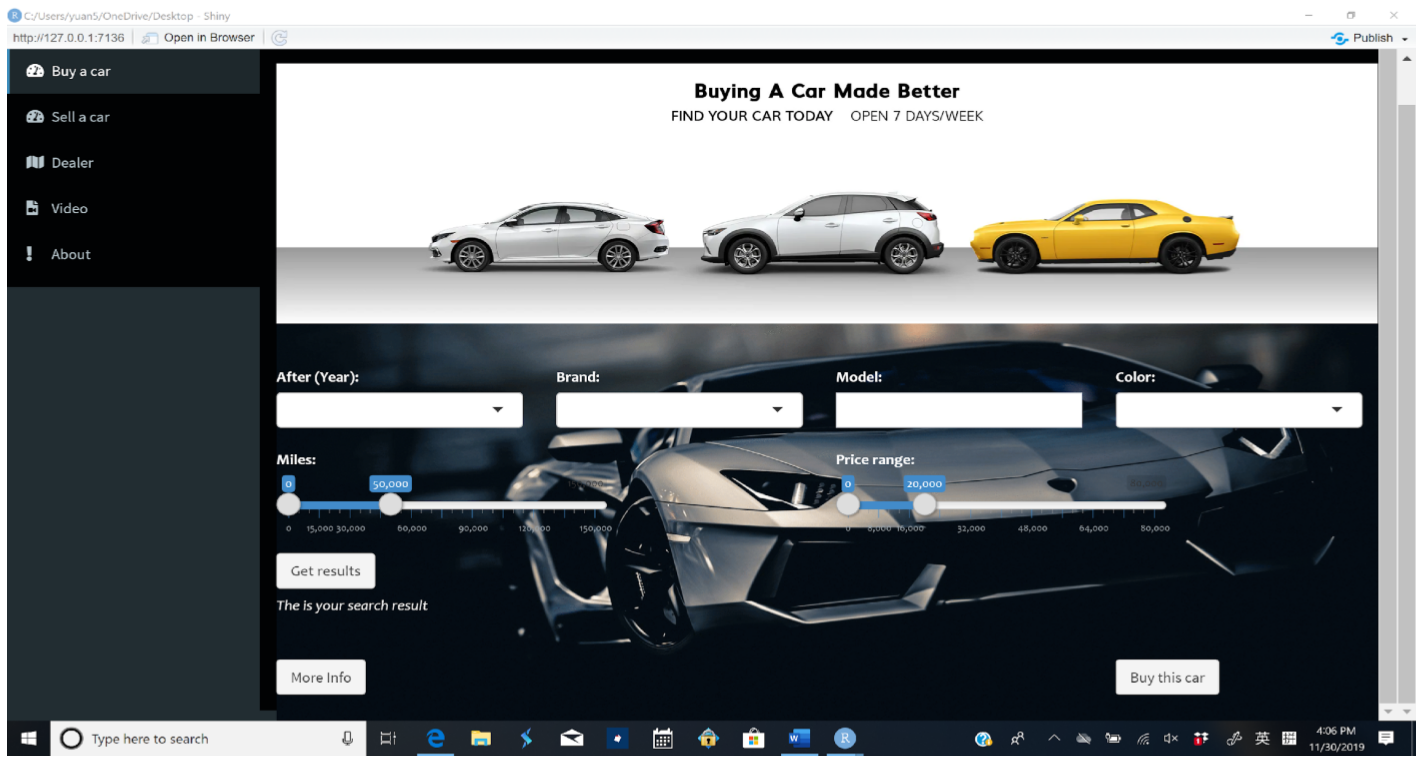
Exhibit 6
This exhibit shows the page for selling a car ( both users dealers and students), users here need to input cars information correctly in order to match with customers features
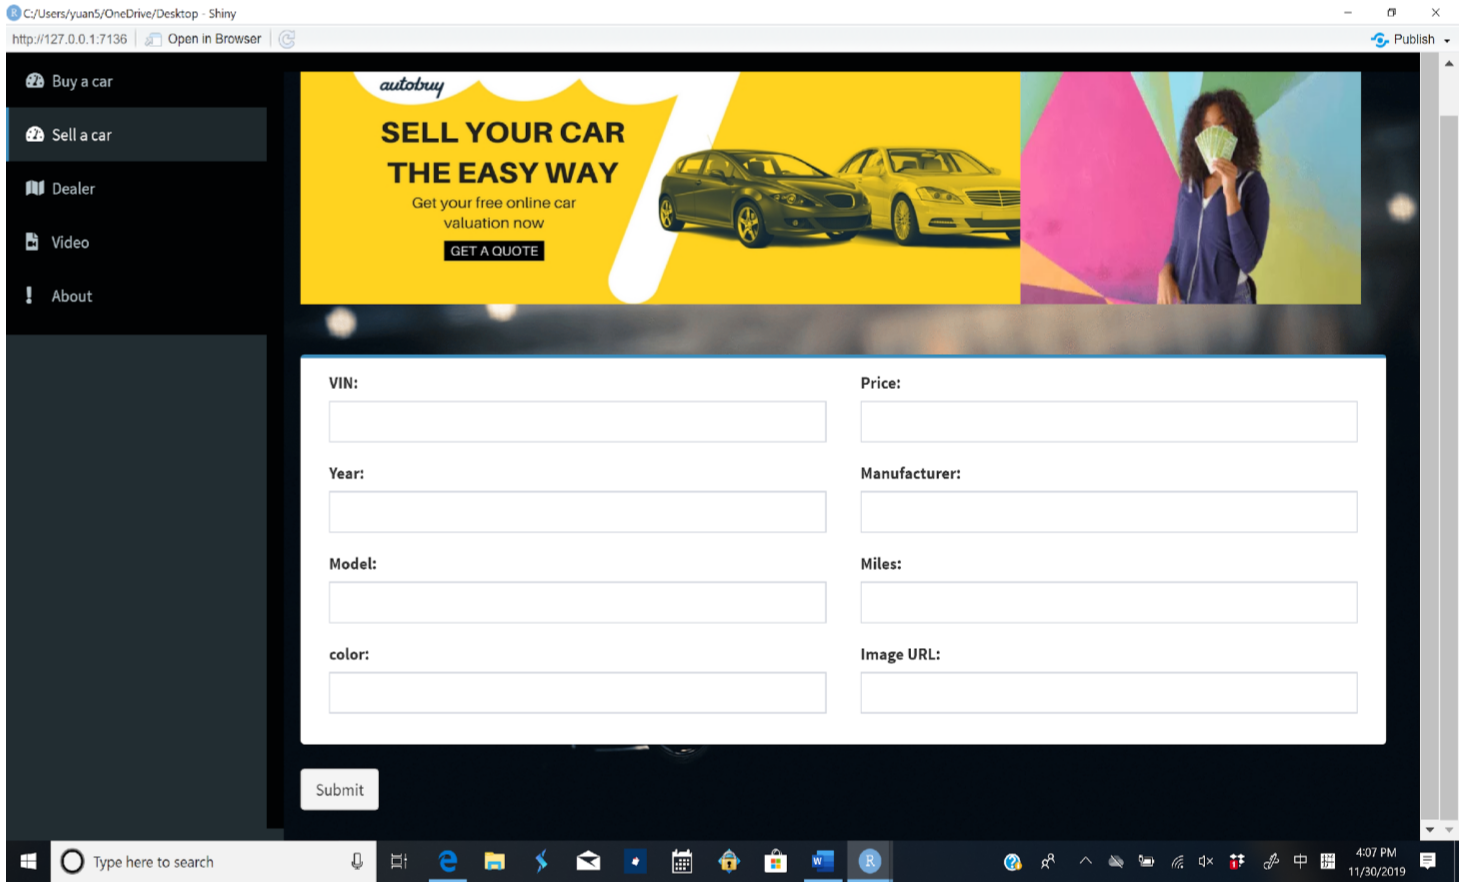
Exhibit 7
The Exhibit shows the dealers information page which provide users with dealer maps and information of cars that they have in their wishing list
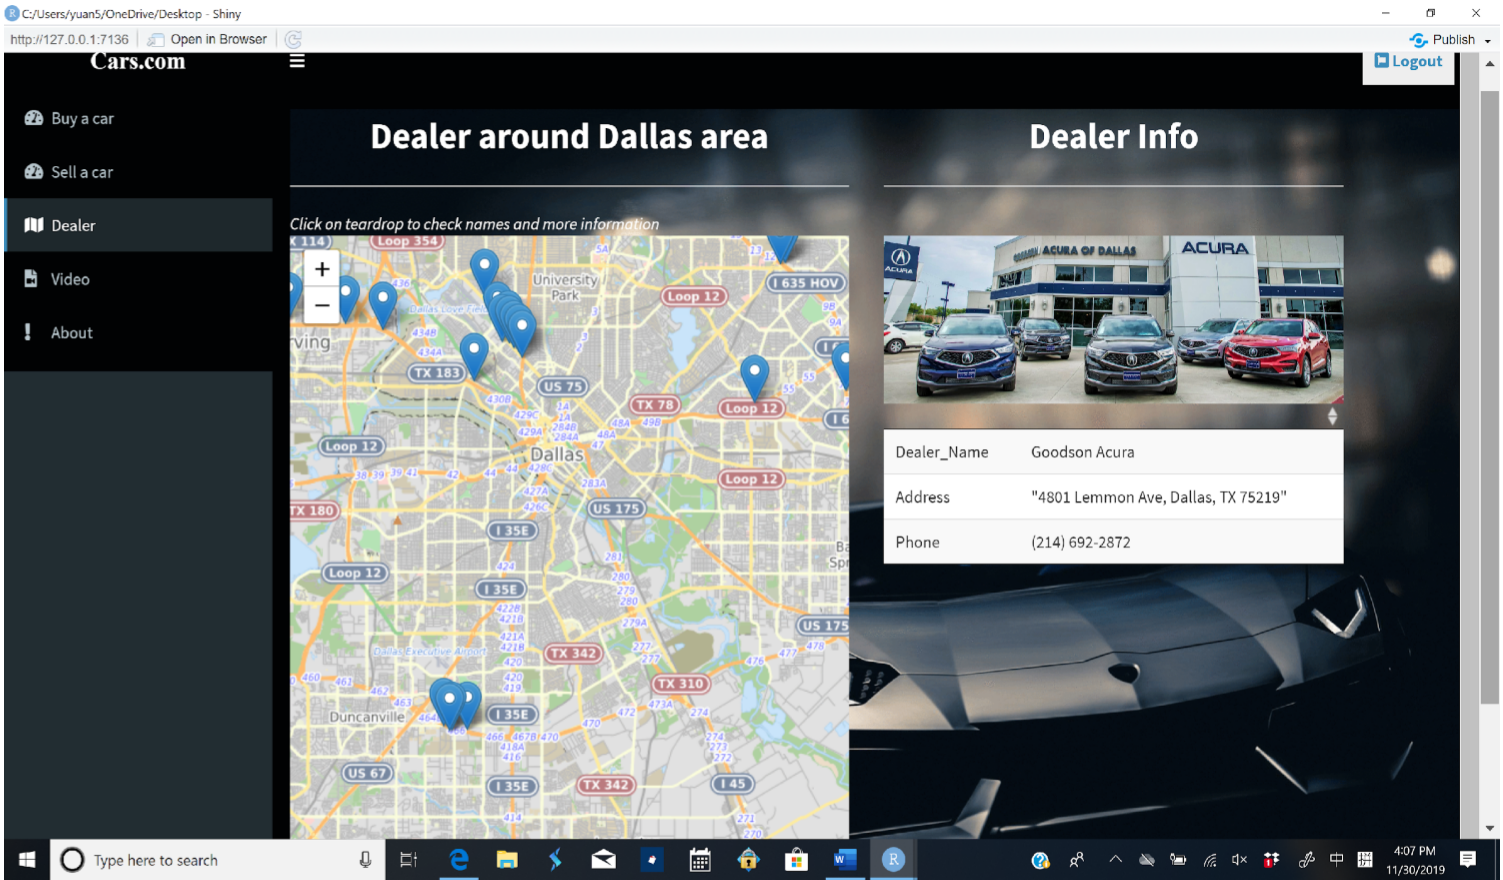
Exhibit 8
This Exhibit show a video tab page, those videos will assist customers in buying skills such as negotiation , communication and driving tests
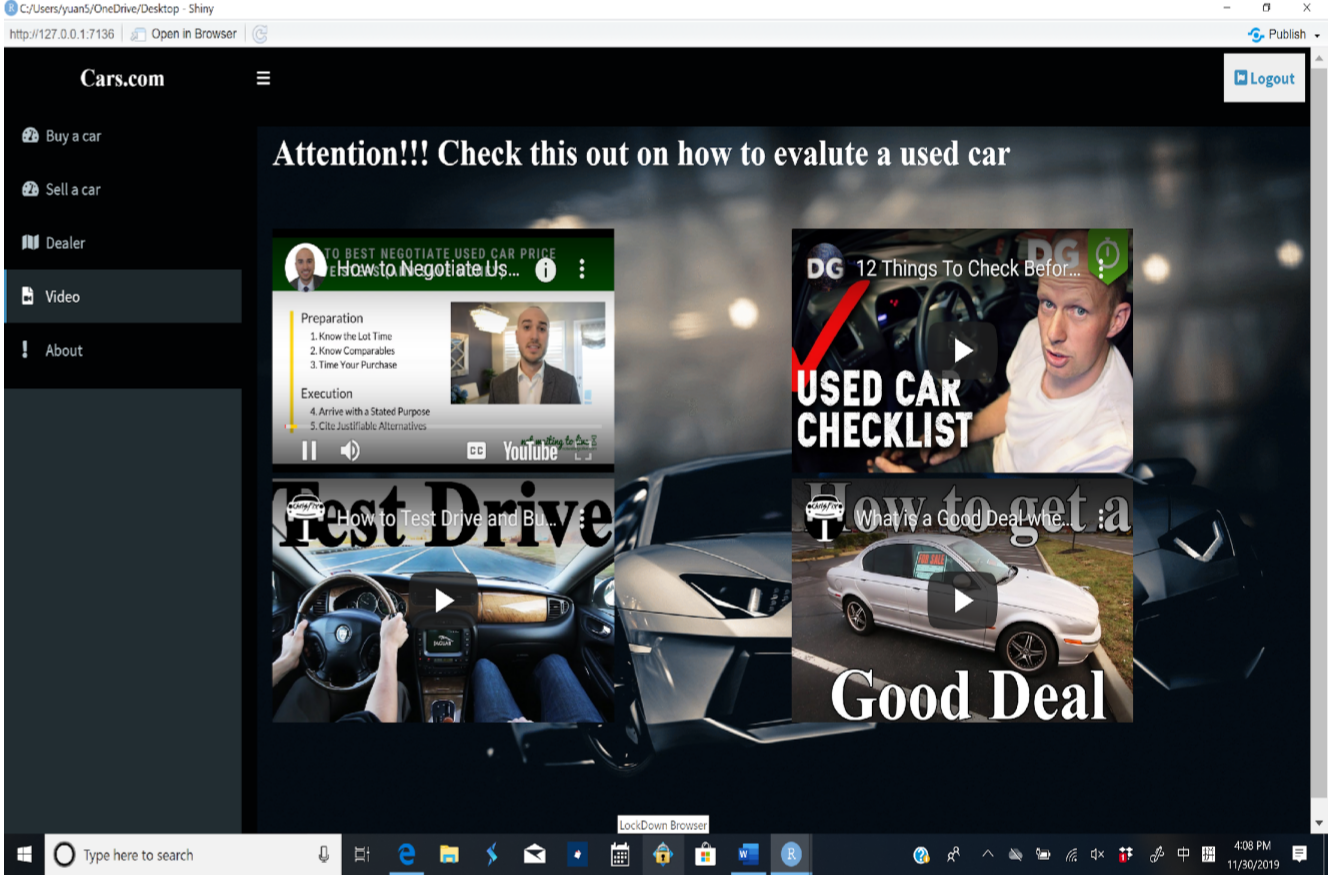
Exhibit 9
The about page tab will tell a story about the website founders and application goals
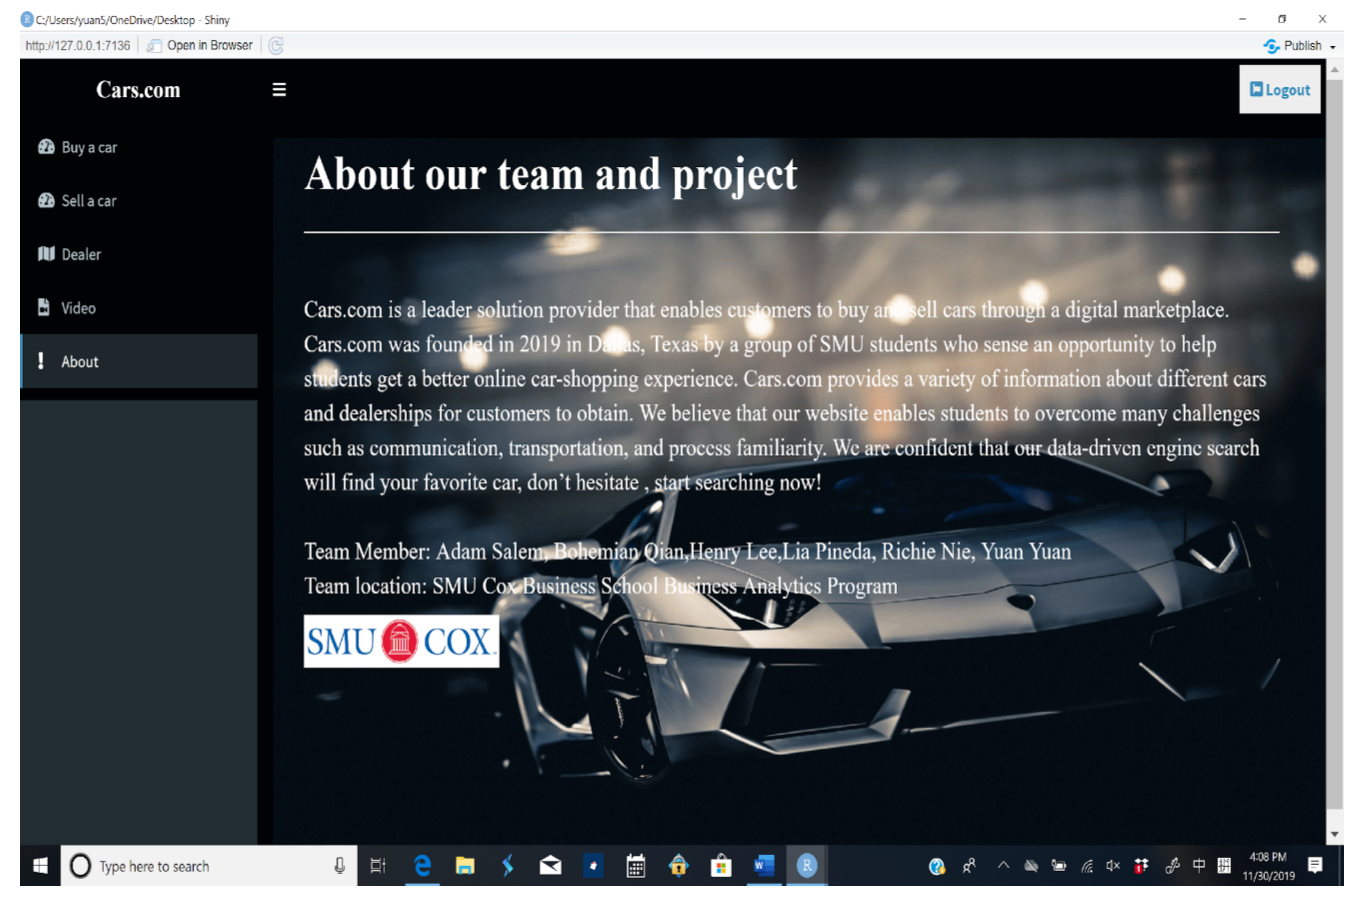
Exhibit 10
This is a special page will help users to manage their inventory specifically for dealers by searching the different demand for different car models
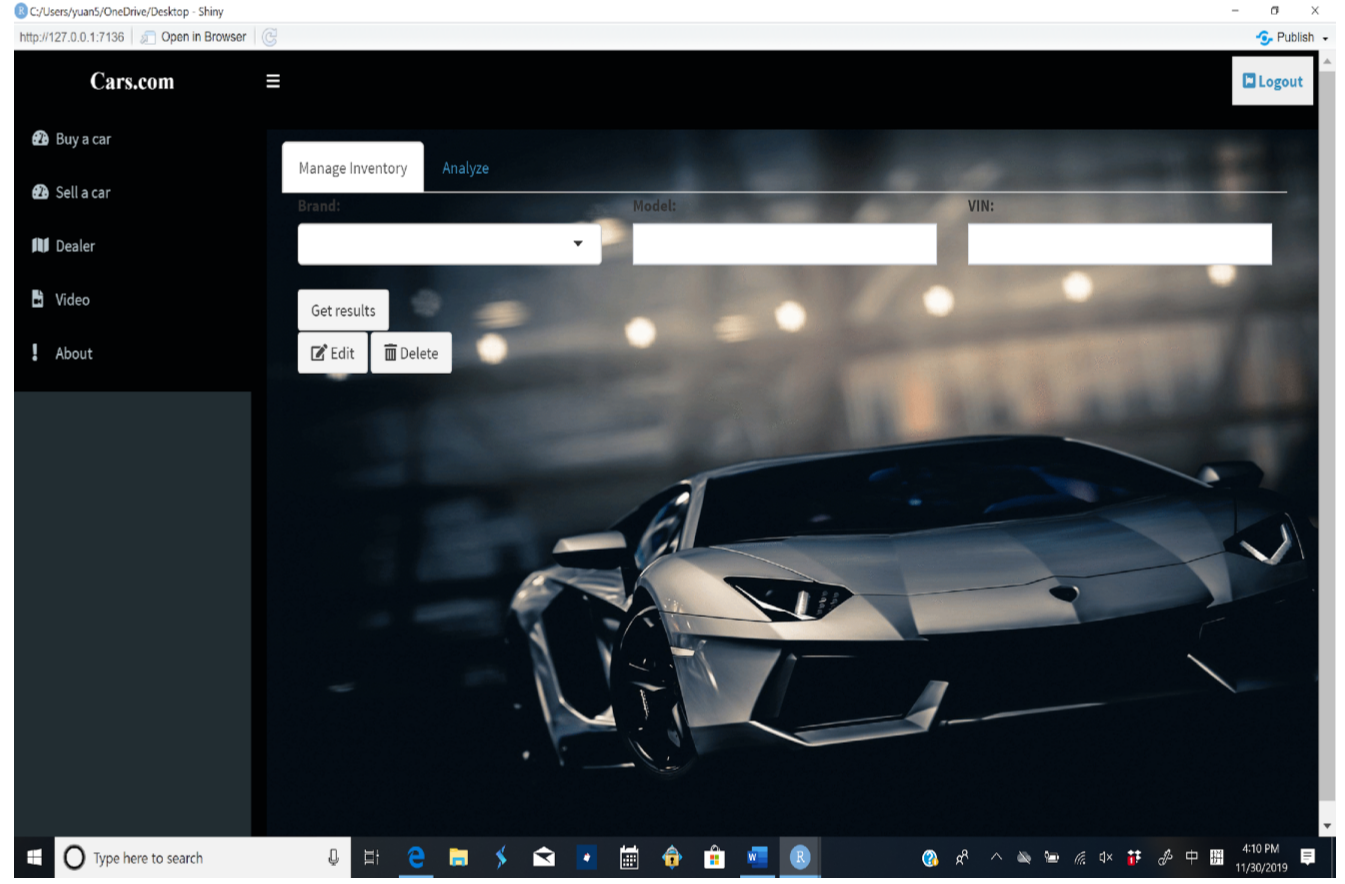
Exhibit 11
This Analyze page shows a distribution to inform customers about the overall demand for car models in the market
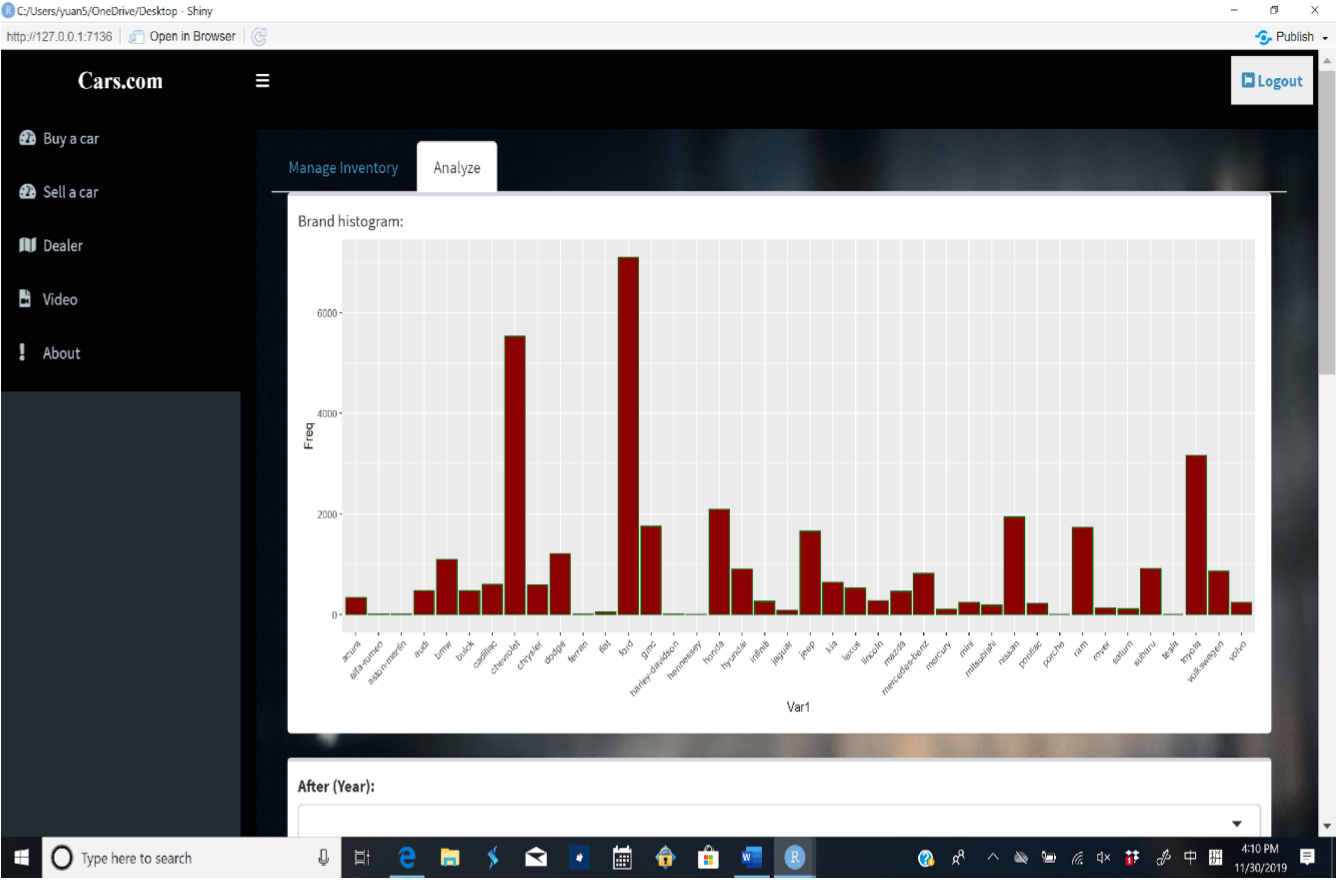
Exhibit 12
The line is a simple linear regression between price and mileage. The black dot above the average line suggests a high price and the dot below the line suggests a good deal for customers